Tuesday, January 27, 2009

Eclipse Debugger, part VI

Recently I've told you about the Expressions view, which allows one to view the values of different expressions. There is also another view, called Display, which can do similar things, but works in a little bit different way.
The Display view is not opened by default in the Debug perspective, so to open it go to Window->Show View->Other->Debug->Display. The UI of this view is rather simple, but it can be very useful, it gives you the possibility to:
  • evaluate any expression and display its value
  • execute given expression
  • create a watch expression
How does it work? Just write any valid expression in the Display view (you can use Content Assist) and run actions from the view's toolbar.
The view can be used as a kind of scrapbook, where you can easily enter some elements of code and experiment a little bit while debugging.

Friday, January 23, 2009

How to embed GMF into a multipage editor?

Today I have been looking through our blog archive and I have found a draf of a post about embedding GMF into a mulitpage editor. I was very surprised as the post was completed, so I wonder why I hadn't published it back then.
So here it is without any changes (better late then never):

Recently I had to find a way to embed GMF into a multipage editor. I had the experience with GMF, but I didn't know how to create a multipage editor, however, it went pretty easy and straightforward. For this short tutorial I will use the multipage editor example described here and the GMF MindMap example (you can check out the source code from the CVS). What we want to achieve it to embed the GMF editor into the first page of the exemplary multipage editor. If you follow the steps below you should get the desired result.
  • In org.eclipse.ui.examples.multipageeditor project find MultiPageEditorExample class and copy it to the org.eclipse.gmf.examples.mindmap.diagram.part package of org.eclipse.gmf.examples.mindmap.diagram project. There will be some error, but we will take care of them later on.
  • In MultiPageEditorExample you will find field private TextEditor editor; change it's type to MindmapDiagramEditor which is the class of GMF editor. Also in the method MultiPageEditorExample#createPage0 change the constructor call for the field editor.
  • Let's look now at the errors - they are mostly connected to MessageUtil class, which we simply don't have in our GMF project, however, we need some strings to pass them to the methods - we can put there any string we find appropriate (and later of course we can externalise those strings).
  • Now there should be only one error left. To get rid of it we can just comment out the method MultiPageEditorExample#sortWords and every call of this method.
  • For this moment we shouldn't see any errors in out diagram project. Now we have to change the editor class that is defined in the plugin.xml of org.eclipse.gmf.examples.mindmap.diagram project. Open the file, go to the Extensions tab, go to org.eclipse.ui.editors and there you should find one entry with the editor definition. Change the class attribute to point to our multipage editor (class MultiPageEditorExample).
  • Here it is! You should see the editor semillar to the one on the screenshot below:
    I know that this is the dirty way, but if you need to do this fast, or you don't know how to start then I guess this can be a good starting point.

Tuesday, January 20, 2009

Eclipse Debugger, part V

The third view that is extremely important for me while debugging is the Expressions view. This view allows to monitor the value of (as the name says) any expressions.

How to add expressions?
Just select the expression in the Java editor while debugging and choose Watch option from the context menu. The expression will immediately appear in the Expressions view.
You can also right click in the Expressions view and choose Add Watch Expression... option.

How to edit expressions?
If you have already some expressions added you can easily edit them by right clicking on the expression and choosing Edit Watch Expression.
What is important is that you can put any expression in this view - not only the ones that are in the code - if you want to check some hypothetical value then you can do that!

The are also some other interesting options in the context menu:
  • you can copy expressions to the clipboard
  • you can remove expressions
  • you can look for expressions
  • you can enable/disable expressions
  • you can reevaluate expressions

In the view's toolbar you will find options to:
  • show type names - shows the type names of the evaluated expressions
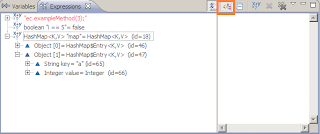
  • show logical structures - while browsing the evaluated value of the expression you can look at its logical structure. e.g. instead of looking into the internals of the Map object:

    you can see the logical structure of the map:


  • create new watch expression (the 3rd way to do this)
  • remove/remove all expressions from the view
Like in the Variables view, here you can also find interesting possibilities to:
  • change the layout
  • show constants
  • show static variables
  • show qualified names
  • show null array entries
  • show references
This view can be really helpful, especially when you want to see how the values of particular expression change while debugging the code.

Tuesday, January 13, 2009

Eclipse Debugger, part IV

As I said in the previous part this time I will focus on the Variables view, which helps us preview the values of variables during the process of debugging.

The view itself is rather straightfoward, however, I'm not sure if everyone knows about the options available in the view's menu like:
  • changing the layout of the view - e.g. the view can be turned into the horizontal orientation or you can change the displayed columns
  • for java debugging you can turn on/of showing:
    • constants
    • static variables
    • qualified names
    • null array entries
    • referneces (I have already written about this: point 3) in this post)
I thing it is good to go through all this options and see how they work as some of them can be extremely useful while debugging.

One more thing worth mentioning is the possinility to change the details formatter. Look here if you want more details.

Looking for your comments!

P.S. Look to the comments for information about Logical Structures available in the Variables view. Thanks Curtis for this!

Wednesday, January 7, 2009

OSGi Services in PDE Registry!

Starting with today's Eclipse build you can finally control OSGi services running inside Eclipse. Simply go to your favourite Plug-in registry view and Group view contents by Services.


Having done that, you should see all running services in one place, ordered by their names, with their properties and list of bundles using each service instance.


Using view filter it's now pretty easy to search for particular service or explore interfaces provided by different bundles.

The next step is to see the details of launched self-hosted Eclipse or OSGi instance.

Monday, January 5, 2009

Eclipse Debugger, part III

Let's continue our tour through the features of the Eclipse debugger. In the last parts (Part I, Part II) I was writing mostly about breakpoints and this time won't be any different. When we look at the views provided by the debugger we will find

the Breakpoints view.


The main purpose of this view is to manage the breakpoints - it allows to easily (going from left to right through the buttons on the view's toolbar):
  • remove selected breakpoints - I guess it's self explaining
  • remove all breakpoints - I guess it's self explaining
  • show breakpoints supported by selected target - when you debug different kind of artifacts (code in java or C or ant build script) you can make the Breakpoints view show only the breakpoints that are supported by this type of the given artifact [Thanks Jacek for helping with figuring this out!]
  • go to the file for breakpoint - it will show the place where the breakpoint is set in the editor
  • skip all breakpoints - when you don't want any breakpoint to be active check this option
  • add java exception breakpoint - I was writing about this in the first part
More cool features can be found in the view's menu, you can:
  • group the breakpoint by many criteria, e.g. type, project, files, etc.
  • define breakpoints working set
  • check the option to show qualified names in the view
The view allows you also to change the breakpoints' properties directly from the context menu - just right click on any breakpoint and you would see the options to:
  • change the hit count value
  • make the breakpoint suspend the VM or suspend the thread
To finish the breakpoints story it has to be said that breakpoint can be imported and exported - you can open the appropriate wizards from the Breakpoints menu or from the File->Export->Run/Debug->Breakpoints option.

Is there anything I have missed about breakpoints? Please, share!

That's it for this week - next time I will focus on the Variables view, which is essential for efficient debugging.